Pandas Manual
Hello Pandas!
Introduction
- Pandas 是 Python 语言的一个扩展程序库,用于数据分析
- Pandas 是一个开放源码、BSD 许可的库,提供高性能、易于使用的数据结构和数据分析工具
- Pandas 名字衍生自术语 “panel data”(面板数据)和 “Python data analysis”(Python 数据分析)
- Pandas 一个强大的分析结构化数据的工具集,基础是 Numpy(提供高性能的矩阵运算)
- Pandas 可以从各种文件格式比如 CSV、JSON、SQL、Microsoft Excel 导入数据
- Pandas 可以对各种数据进行运算操作,比如归并、再成形、选择,还有数据清洗和数据加工特征
- Pandas 广泛应用在学术、金融、统计学等各个数据分析领域

Application
Pandas 的主要数据结构是 Series (一维数据)与 DataFrame(二维数据)
这两种数据结构足以处理金融、统计、社会科学、工程等领域里的大多数典型用例
Data Structure
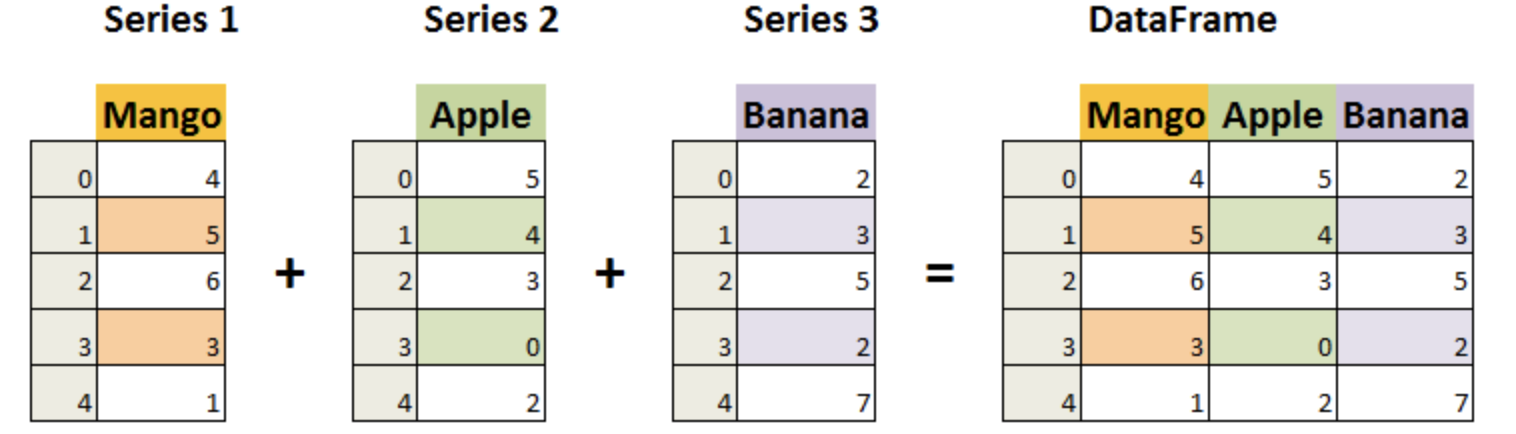
Series是一种类似于一维数组的对象,它由一组数据(各种Numpy数据类型)以及一组与之相关的数据标签(即索引)组成DataFrame是一个表格型的数据结构,它含有一组有序的列,每列可以是不同的值类型(数值、字符串、布尔型值)DataFrame既有行索引也有列索引,它可以被看做由Series组成的字典(共同用一个索引)
Links
-
Pandas 源代码:https://github.com/pandas-dev/pandas
-
Pandas 官网:https://pandas.pydata.org/
Downloads
For Windows
使用pip或者conda安装,这两个都是Python的包管理工具,是安装第三方库的主要方式。在 CMD 命令提示符界面行执行以下命令:
pip install pandas
或者
conda install pandas
你也可以安装特定版本的Pandas:
pip install pandas=0.20.3
使用pip进行安装常会出现下载慢,甚至请求超时的情况,这主要是因为pip请求的服务器PyPl在国外,网速肯定是慢的。
要解决这个问题,建议使用镜像安装,也就是服务器在国内的下载源,基本与PyPl保持同步,比如像清华源、豆瓣源、阿里云源等。
使用镜像源有两种方式,以清华源为例:
1.临时使用
pip install -i https://pypi.tuna.tsinghua.edu.cn/simple some-package pandas
除了matplotib是要写安装的库名外,其他都是固定格式
2.设为默认
pip config set global.index-url https://pypi.tuna.tsinghua.edu.cn/simple
设为默认后,以后安装库都是从清华源下载,而且无需再加镜像源网址
pandas必须的依赖库有三个,分别是numpy、python-dateutil、pytz
比如说numpy版本低了,那可以重新安装相应版本,就能解決安装错误的问题了
pip install numpy==1.17.3
For MacOS
对于 Mac 用户而言,只需在您的终端Terminal中进行以上相同的命令行操作即可
不过我们强烈建议您直接安装Anaconda或者Miniconda,这也是最简单的安装Pandas的方式;
Anaconda和Miniconda是Python的数据科学发行版本,自带了Python软件本身,以及Pandas、Matplotib等上百种数据科学库,一次安装,一劳永逸;
Anaconda和Miniconda本身的安装及其简单,只需要去它们官网下载安装包,直接一路next就能搞定;
对于初学者来说是提升效率的最佳方式,不会因为安装及版本调试的麻烦而产生对Python的烦躁,以至于还没用起来就放弃了;
同时,这也是Pandas官网推荐的安装方式,如果您是专注于解决数据问题,那么用它们就对了。
Pandas Series
认识Series对象
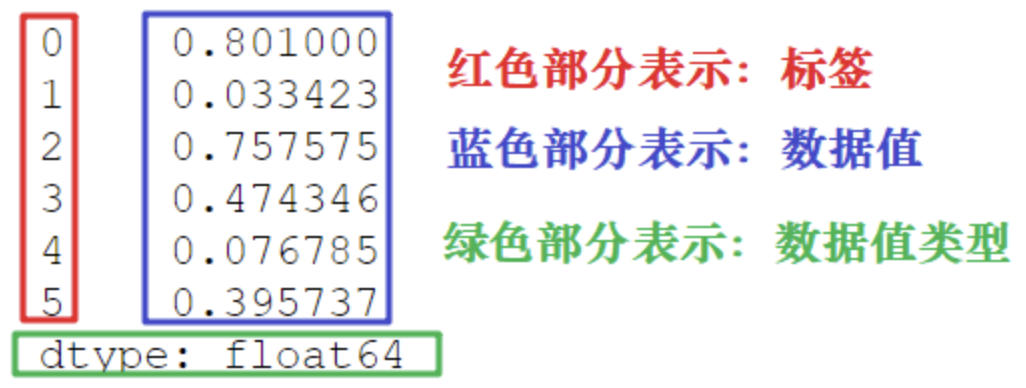
Series 结构,也称 Series 序列,是 Pandas 常用的数据结构之一,它是一种类似于一维数组的结构,由一组数据值(value)和一组标签组成,其中标签与数据值之间是一一对应的关系。
Series 可以保存任何数据类型,比如字符串、浮点数、Python 对象等,它的标签默认为整数,从 0 开始依次递增。Series 的结构图如下所示:
创建Series对象
Pandas 使用 Series() 函数来创建 Series 对象
导入 pandas 一般使用别名 pd 来代替:
import pandas as pd
s = pd.Series(data, index, dtype, copy)
参数说明如下所示:
-
data:输入的数据,可以是列表、常量、ndarray 数组等。 -
index:索引值必须是惟一的,如果没有传递索引,则默认为np.arrange(n),即按照从0到n-1的升序排列。 -
dtype:dtype表示数据类型,如果没有提供,则会自动判断得出。 -
copy:表示对 data 进行拷贝,默认为 False。
创建一个空Series对象
import pandas as pd
#输出数据为空
s = pd.Series()
print(s)
Series([], dtype: float64)

FutureWarning: The default dtype for empty Series will be 'object' instead of 'float64' in a future version. Specify a dtype explicitly to silence this warning.
ndarray创建Series对象
当我们没有给Series增加索引时,Series的索引会按照又0到n-1的顺序自动排列
import numpy as np
data = np.array(['a','b','c','d'])
s = pd.Series(data)
print (s)
0    a
1    b
2    c
3    d
dtype: object
我们也可以给一个Series对象增加索引
import pandas as pd
import numpy as np
data = np.array(['a','b','c','d'])
#自定义索引标签(即显示索引)
s = pd.Series(data,index=[100,101,102,103])
print(s)
100    a
101    b
102    c
103    d
dtype: object
dict创建Series对象
把 dict 作为输入数据。如果没有传入索引时会按照字典的键来构造索引
当传递了索引时需要将索引标签与字典中的值一一对应
- 没有传递索引时:
import pandas as pd
import numpy as np
data = {'a' : 0., 'b' : 1., 'c' : 2.}
s = pd.Series(data)
print(s)
a    0.0
b    1.0
c    2.0
dtype: float64
- 传递了索引时:
import pandas as pd
import numpy as np
data = {'a' : 0., 'b' : 1., 'c' : 2.}
s = pd.Series(data,index=['b','c','d','a'])
print(s)
b    1.0
c    2.0
d    NaN
a    0.0
dtype: float64
值得一提的是,在本例中若通过索引’d’访问series数据,返回的将是’NaN’
标量创建Series对象
如果 data 是标量值,则必须提供索引,示例如下:
import pandas as pd
import numpy as np
s = pd.Series(5, index=[0, 1, 2, 3])
print(s)
0    5
1    5
2    5
3    5
dtype: int64
访问series数据
访问 Series 序列中元素分为两种方式,一种是位置索引访问;另一种是索引标签访问
位置索引访问
我们知道数组的索引计数从 0 开始,这表示第一个元素存储在第 0 个索引位置上,以此类推,就可以获得 Series 序列中的每个元素。下面看一组简单的示例:
import pandas as pd
s = pd.Series([1,2,3,4,5],index = ['a','b','c','d','e'])
print(s[0])  #位置下标
1
通过切片的方式访问 Series 序列中的数据,示例如下:
print(s[:3])
a    1
b    2
c    3
dtype: int64
print(s[-3:])
c    3
d    4
e    5
dtype: int64
索引标签访问
Series 类似于固定大小的 dict,把 index 中的索引标签当做 key,而把 Series 序列中的元素值当做 value,然后通过 index 索引标签来访问或者修改元素值。
s = pd.Series([6,7,8,9,10],index = ['a','b','c','d','e'])
print(s['a'])
6
使用索引标签访问多个元素值
print(s[['a','c','d']])
a    6
c    8
d    9
dtype: int64
如果使用了 index 中不包含的标签,则会触发异常:
s = pd.Series([6,7,8,9,10],index = ['a','b','c','d','e'])
#不包含f值
print(s['f'])
---------------------------------------------------------------------------
KeyError                                  Traceback (most recent call last)

File ~/anaconda3/envs/sccancer_py38/lib/python3.8/site-packages/pandas/core/indexes/base.py:3803, in Index.get_loc(self, key, method, tolerance)
   3802 try:
-> 3803     return self._engine.get_loc(casted_key)
   3804 except KeyError as err:

File ~/anaconda3/envs/sccancer_py38/lib/python3.8/site-packages/pandas/_libs/index.pyx:138, in pandas._libs.index.IndexEngine.get_loc()

File ~/anaconda3/envs/sccancer_py38/lib/python3.8/site-packages/pandas/_libs/index.pyx:165, in pandas._libs.index.IndexEngine.get_loc()

File pandas/_libs/hashtable_class_helper.pxi:5745, in pandas._libs.hashtable.PyObjectHashTable.get_item()

File pandas/_libs/hashtable_class_helper.pxi:5753, in pandas._libs.hashtable.PyObjectHashTable.get_item()

KeyError: 'f'

The above exception was the direct cause of the following exception:

KeyError                                  Traceback (most recent call last)

Cell In[20], line 3
      1 s = pd.Series([6,7,8,9,10],index = ['a','b','c','d','e'])
      2 #不包含f值
----> 3 print(s['f'])

File ~/anaconda3/envs/sccancer_py38/lib/python3.8/site-packages/pandas/core/series.py:981, in Series.__getitem__(self, key)
    978     return self._values[key]
    980 elif key_is_scalar:
--> 981     return self._get_value(key)
    983 if is_hashable(key):
    984     # Otherwise index.get_value will raise InvalidIndexError
    985     try:
    986         # For labels that don't resolve as scalars like tuples and frozensets

File ~/anaconda3/envs/sccancer_py38/lib/python3.8/site-packages/pandas/core/series.py:1089, in Series._get_value(self, label, takeable)
   1086     return self._values[label]
   1088 # Similar to Index.get_value, but we do not fall back to positional
-> 1089 loc = self.index.get_loc(label)
   1090 return self.index._get_values_for_loc(self, loc, label)

File ~/anaconda3/envs/sccancer_py38/lib/python3.8/site-packages/pandas/core/indexes/base.py:3805, in Index.get_loc(self, key, method, tolerance)
   3803     return self._engine.get_loc(casted_key)
   3804 except KeyError as err:
-> 3805     raise KeyError(key) from err
   3806 except TypeError:
   3807     # If we have a listlike key, _check_indexing_error will raise
   3808     #  InvalidIndexError. Otherwise we fall through and re-raise
   3809     #  the TypeError.
   3810     self._check_indexing_error(key)

KeyError: 'f'
Series常用属性
在下表列出了 Series 对象的常用属性:
| 名称 | 属性 |
|---|---|
| axes | 以列表的形式返回所有行索引标签 |
| dtype | 返回对象的数据类型 |
| empty | 返回一个空的 Series 对象 |
| ndim | 返回输入数据的维数 |
| size | 返回输入数据的元素数量 |
| values | 以ndarray 的形式返回 Series 对象 |
| index | 返回一个Rangelndex对象,用来描述索引的取值范围 |
现在随机创建一个series对象,用来演示上述属性
import pandas as pd
import numpy as np
s = pd.Series(np.random.randn(5))
print(s)
0   -1.144568
1   -0.358787
2    0.774467
3   -1.673744
4    0.148200
dtype: float64
axes
print ("The axes are:")
print(s.axes)
The axes are:
[RangeIndex(start=0, stop=5, step=1)]
上述示例的行索引标签是 [0,1,2,3,4]。
dtype
print ("The dtype is:")
print(s.dtype)
The dtype is:
float64
empty
返回一个布尔值,用于判断数据对象是否为空。示例如下:
print("是否为空对象?")
print (s.empty)
print("是否为空对象?")
y =pd.Series()
print (y.empty)
是否为空对象?
False
是否为空对象?
True
ndim
查看序列的维数。根据定义,Series 是一维数据结构,因此它始终返回 1。
print (s)
print (s.ndim)
0    1.136615
1   -1.316431
2    0.367285
3    1.396443
4    0.993101
dtype: float64
1
values
以数组的形式返回 Series 对象中的数据。
print(s)
print("输出series中数据")
print(s.values)
0    1.136615
1   -1.316431
2    0.367285
3    1.396443
4    0.993101
dtype: float64
输出series中数据
[1.13661528 -1.31643087  0.36728474  1.39644329  0.99310053]
index
该属性用来查看 Series 中索引的取值范围。示例如下:
#显式索引
s=pd.Series([1,2,5,8],index=['a','b','c','d'])
print(s.index)
#隐式索引
s1=pd.Series([1,2,5,8])
print(s1.index)
Index(['a', 'b', 'c', 'd'], dtype='object')
RangeIndex(start=0, stop=4, step=1)
Series常用方法
查看数据
如果想要查看 Series 的某一部分数据,可以使用 head() 或者 tail() 方法。其中 head() 返回前 n 行数据,默认显示前 5 行数据。示例如下:
s = pd.Series(np.random.randn(5))
print ("The original series is:")
print (s)
print("返回前三行数据")
print (s.head(3))
The original series is:
0   -0.834111
1    1.024426
2   -0.888609
3    0.186547
4    0.711474
dtype: float64
返回前三行数据
0   -0.834111
1    1.024426
2   -0.888609
dtype: float64
tail() 返回的是后 n 行数据,默认为后 5 行。示例如下:
#原series
print(s)
print("输出后两行数据")
print (s.tail(2))
0   -0.834111
1    1.024426
2   -0.888609
3    0.186547
4    0.711474
dtype: float64
输出后两行数据
3    0.186547
4    0.711474
dtype: float64
检测缺失值
isnull() 和 nonull() 用于检测 Series 中的缺失值。所谓缺失值,顾名思义就是值不存在、丢失、缺少。
isnull():如果值缺失,则返回 True。notnull():如果值缺失,则返回 False。
s=pd.Series([1,2,5,None])
print(pd.isnull(s))  #是空值返回True
print(pd.notnull(s)) #空值返回False
0    False
1    False
2    False
3     True
dtype: bool
0     True
1     True
2     True
3    False
dtype: bool
Pandas DataFrame
认识DataFrame结构
DataFrame 一个表格型的数据结构,既有行标签(index),又有列标签(columns),它也被称异构数据表,所谓异构,指的是表格中每列的数据类型可以不同,比如可以是字符串、整型或者浮点型等。其结构图示意图,如下所示:
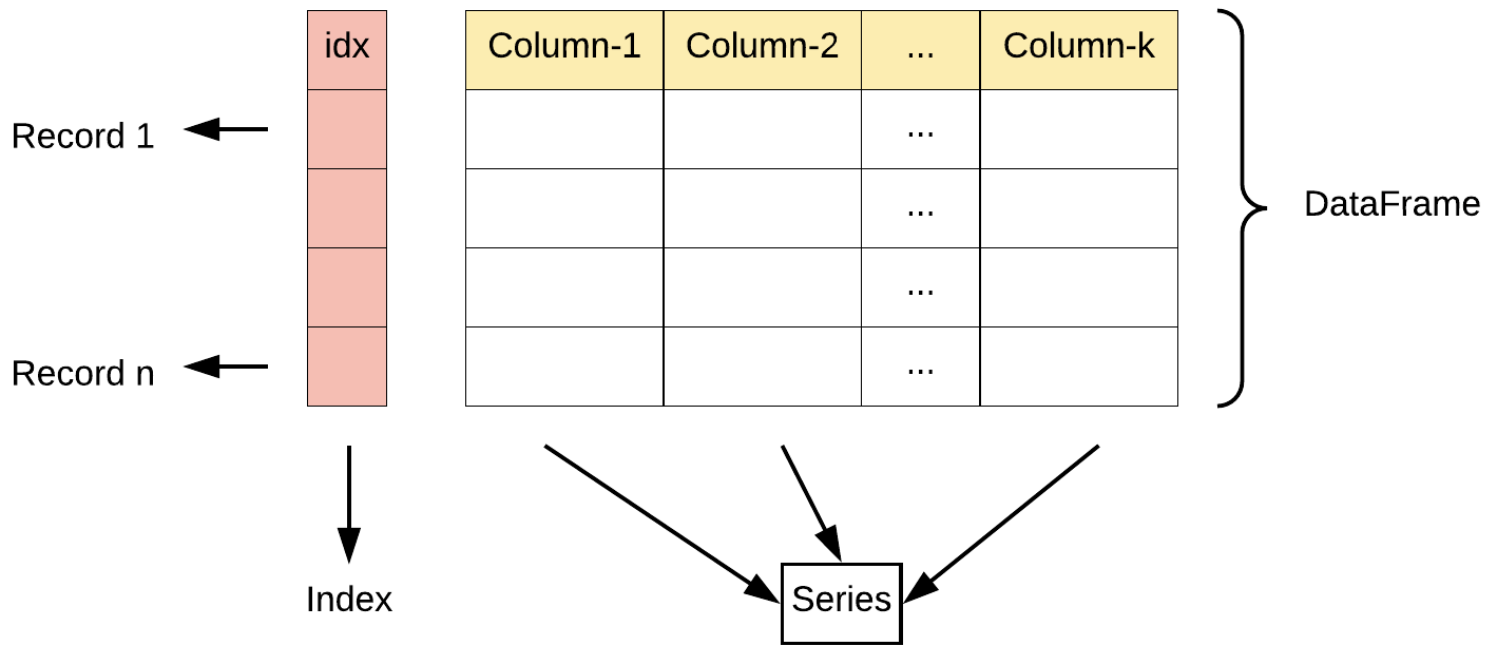
同 Series 一样,DataFrame 自带行标签索引,默认为“隐式索引”即从 0 开始依次递增,行标签与 DataFrame 中的数据项一一对应。上述表格的行标签从 0 到 4,共记录了 4 条数据。当然你也可以用“显式索引”的方式来设置行标签。
创建DataFrame对象
import pandas as pd
pd.DataFrame( data, index, columns, dtype, copy)
| 参数名称 | 说明 |
|---|---|
| data | 输入的数据,可以是ndarray,series, list, dict, 标量以及一个 DataFrame |
| index | 行标签,如果没有传递 index 值,则默认行标签是 np.arange(n),n代表data 的元素个数 |
| columns | 列标签,如果没有传递 columns 值,则默认列标签是 np.arange(n) |
| dtype | dtype表示每一列的数据类型 |
| copy | 默认为 False,表示复制数据 data |
创建空的DataFrame对象
使用下列方式创建一个空的 DataFrame
df = pd.DataFrame()
print(df)
Empty DataFrame
Columns: []
Index: []
列表创建DataFame对象
1.单一列表创建 DataFrame:
data = [1,2,3,4,5]
df = pd.DataFrame(data)
print(df)
   0
0  1
1  2
2  3
3  4
4  5
2.使用嵌套列表创建 DataFrame 对象:
data = [['Alex',10],['Bob',12],['Clarke',13]]
df = pd.DataFrame(data,columns=['Name','Age'])
print(df)
     Name  Age
0    Alex   10
1     Bob   12
2  Clarke   13
3.指定数值元素的数据类型为 float:
data = [['Alex',10],['Bob',12],['Clarke',13]]
df = pd.DataFrame(data,columns=['Name','Age'],dtype=float)
print(df)
     Name   Age
0    Alex  10.0
1     Bob  12.0
2  Clarke  13.0
字典嵌套列表创建
data = {'Name':['Tom', 'Jack', 'Steve', 'Ricky'],'Age':[28,34,29,42]}
df = pd.DataFrame(data)
print(df)
    Name  Age
0    Tom   28
1   Jack   34
2  Steve   29
3  Ricky   42
注意:这里使用了默认行标签,也就是 range(n),它生成了 0,1,2,3,并分别对应了列表中的每个元素值。
现在给上述示例添加自定义的行标签:
data = {'Name':['Tom', 'Jack', 'Steve', 'Ricky'],'Age':[28,34,29,42]}
df = pd.DataFrame(data, index=['rank1','rank2','rank3','rank4'])
print(df)
        Name  Age
rank1    Tom   28
rank2   Jack   34
rank3  Steve   29
rank4  Ricky   42
列表嵌套字典创建DataFrame对象
data = [{'a': 1, 'b': 2},{'a': 5, 'b': 10, 'c': 20}]
df = pd.DataFrame(data, index=['first', 'second'])
print(df)
        a   b     c
first   1   2   NaN
second  5  10  20.0
Series创建DataFrame对象
可以传递一个字典形式的 Series,从而创建一个 DataFrame 对象,其输出结果的行索引是所有 index 的并集
d = {'one' : pd.Series([1, 2, 3], index=['a', 'b', 'c']),
   'two' : pd.Series([1, 2, 3, 4], index=['a', 'b', 'c', 'd'])}
df = pd.DataFrame(d)
print(df)
   one  two
a  1.0    1
b  2.0    2
c  3.0    3
d  NaN    4
列索引操作DataFrame
列索引选取数据列
d = {'one' : pd.Series([1, 2, 3], index=['a', 'b', 'c']),
   'two' : pd.Series([1, 2, 3, 4], index=['a', 'b', 'c', 'd'])}
df = pd.DataFrame(d)
print(df ['one'])
a    1.0
b    2.0
c    3.0
d    NaN
Name: one, dtype: float64
列索引添加数据列
使用 columns 列索引表标签可以实现添加新的数据列
d = {'one' : pd.Series([1, 2, 3], index=['a', 'b', 'c']),
   'two' : pd.Series([1, 2, 3, 4], index=['a', 'b', 'c', 'd'])}
df = pd.DataFrame(d)
print("使用df['列']=值,插入新的数据列")
df['three']=pd.Series([10,20,30],index=['a','b','c'])
print(df)
print("将已经存在的数据列做相加运算")
df['four']=df['one']+df['three']
print(df)
使用df['列']=值,插入新的数据列
   one  two  three
a  1.0    1   10.0
b  2.0    2   20.0
c  3.0    3   30.0
d  NaN    4    NaN
将已经存在的数据列做相加运算
   one  two  three  four
a  1.0    1   10.0  11.0
b  2.0    2   20.0  22.0
c  3.0    3   30.0  33.0
d  NaN    4    NaN   NaN
使用 insert() 方法插入新的列
info=[['Jack',18],['Helen',19],['John',17]]
df=pd.DataFrame(info,columns=['name','age'])
print(df)
#注意是column参数
#数值1代表插入到columns列表的索引位置
df.insert(1,column='score',value=[91,90,75])
print(df)
    name  age
0   Jack   18
1  Helen   19
2   John   17
    name  score  age
0   Jack     91   18
1  Helen     90   19
2   John     75   17
列索引删除数据列
通过 del 和 pop() 都能够删除 DataFrame 中的数据列
d = {'one' : pd.Series([1, 2, 3], index=['a', 'b', 'c']),
   'two' : pd.Series([1, 2, 3, 4], index=['a', 'b', 'c', 'd']),
   'three' : pd.Series([10,20,30], index=['a','b','c'])}
df = pd.DataFrame(d)
print ("Our dataframe is:")
print(df)
#使用del删除
del df['one']
print(df)
#使用pop方法删除
df.pop('two')
print (df)
Our dataframe is:
   one  two  three
a  1.0    1   10.0
b  2.0    2   20.0
c  3.0    3   30.0
d  NaN    4    NaN
   two  three
a    1   10.0
b    2   20.0
c    3   30.0
d    4    NaN
   three
a   10.0
b   20.0
c   30.0
d    NaN
行索引操作DataFrame
标签索引选取
可以将行标签传递给 loc 函数,来选取数据。
d = {'one' : pd.Series([1, 2, 3], index=['a', 'b', 'c']),
   'two' : pd.Series([1, 2, 3, 4], index=['a', 'b', 'c', 'd'])}
df = pd.DataFrame(d)
print(df)
print("loc函数")
print(df.loc['b'])
   one  two
a  1.0    1
b  2.0    2
c  3.0    3
d  NaN    4
loc函数
one    2.0
two    2.0
Name: b, dtype: float64
整数索引选取
通过将数据行所在的索引位置传递给 iloc 函数,也可以实现数据行选取
d = {'one' : pd.Series([1, 2, 3], index=['a', 'b', 'c']),
   'two' : pd.Series([1, 2, 3, 4], index=['a', 'b', 'c', 'd'])}
df = pd.DataFrame(d)
print (df.iloc[2])
one    3.0
two    3.0
Name: c, dtype: float64
切片操作多行选取
d = {'one' : pd.Series([1, 2, 3], index=['a', 'b', 'c']),
   'two' : pd.Series([1, 2, 3, 4], index=['a', 'b', 'c', 'd'])}
df = pd.DataFrame(d)
#左闭右开
print(df[2:4])
   one  two
c  3.0    3
d  NaN    4
添加数据行
使用 append() 函数,可以将新的数据行添加到 DataFrame 中,该函数会在行末追加数据行。示例如下:
df = pd.DataFrame([[1, 2], [3, 4]], columns = ['a','b'])
df2 = pd.DataFrame([[5, 6], [7, 8]], columns = ['a','b'])
#在行末追加新数据行
df = df.append(df2)
print(df)
   a  b
0  1  2
1  3  4
0  5  6
1  7  8
删除数据行
使用行索引标签,利用 drop 函数从 DataFrame 中删除某一行数据。如果索引标签存在重复,那么它们将被一起删除
df = pd.DataFrame([[1, 2], [3, 4]], columns = ['a','b'])
df2 = pd.DataFrame([[5, 6], [7, 8]], columns = ['a','b'])
df = df.append(df2)
print(df)
print("注意此处调用了drop()方法")
df = df.drop(0)
print (df)
   a  b
0  1  2
1  3  4
0  5  6
1  7  8
注意此处调用了drop()方法
   a  b
1  3  4
1  7  8
常用属性和方法汇总
DataFrame 的属性和方法,与 Series 相差无几,如下所示:
| 名称 | 属性&方法描述 |
|---|---|
| T | 行和列转置 |
| axes | 返回一个仅以行轴标签和列轴标签为成员的列表 |
| dtypes | 返回每列数据的数据类型 |
| empty | DataFrame中没有数据或者任意坐标轴的长度为0,则返回True |
| ndim | 轴的数量,也指数组的维数 |
| shape | 返回一个元组,表示了 DataFrame 维度 |
| size | DataFrame中的元素数量 |
| values | 使用numpy 数组表示 DataFrame 中的元素值 |
| head() | 返回前n行数据 |
| tail() | 返回后n行数据 |
| shift() | 将行或列移动指定的步幅长度 |
Transpose
返回 DataFrame 的转置,也就是把行和列进行交换。
d = {'Name':pd.Series(['c语言中文网','编程帮',"百度",'360搜索','谷歌','微学苑','Bing搜索']),
   'years':pd.Series([5,6,15,28,3,19,23]),
   'Rating':pd.Series([4.23,3.24,3.98,2.56,3.20,4.6,3.8])}
#构建DataFrame
df = pd.DataFrame(d)
print(df)
print("输出DataFrame的转置")
print(df.T)
     Name  years  Rating
0  c语言中文网      5    4.23
1     编程帮      6    3.24
2      百度     15    3.98
3   360搜索     28    2.56
4      谷歌      3    3.20
5     微学苑     19    4.60
6  Bing搜索     23    3.80
输出DataFrame的转置
             0     1     2      3    4    5       6
Name    c语言中文网   编程帮    百度  360搜索   谷歌  微学苑  Bing搜索
years        5     6    15     28    3   19      23
Rating    4.23  3.24  3.98   2.56  3.2  4.6     3.8
axes、dtypes、 empty、ndim、 values、head()&tail()查看数据。这些函数与series的作用类似,在这里就不多做介绍了。
shape
返回一个代表 DataFrame 维度的元组。返回值元组 (a,b),其中 a 表示行数,b 表示列数。
d = {'Name':pd.Series(['c语言中文网','编程帮',"百度",'360搜索','谷歌','微学苑','Bing搜索']),
   'years':pd.Series([5,6,15,28,3,19,23]),
   'Rating':pd.Series([4.23,3.24,3.98,2.56,3.20,4.6,3.8])}
#构建DataFrame
df = pd.DataFrame(d)
#DataFrame的形状
print(df.shape)
(7, 3)
size
返回 DataFrame 中的元素数量。
print(df.size)
21
Python Pandas描述性统计
下列表格对 Pandas 常用的统计学函数做了简单的总结:
| 函数名称 | 描述说明 |
|---|---|
| count | 统计某个非空值的数量 |
| sum() | 求和 |
| mean() | 求均值 |
| median() | 求中位数 |
| mode() | 求众数 |
| std() | 求标准差 |
| min() | 求最小值 |
| max() | 求最大值 |
| abs() | 求绝对值 |
| prod() | 求所有数值的乘积 |
| cumsum() | 计算累计和,axis=0,按照行累加;axis=1,按照列累加 |
| cumprod() | 计算累计积,axis=0,按照行累积;axis=1,按照列累积 |
| corr() | 计算数列或变量之间的相关系数,取值-1到1,值越大表示关联性越强 |
在 DataFrame 中,使用聚合类方法时需要指定轴(axis)参数。下面介绍两种传参方式:
对行操作,默认使用 axis=0 或者使用 “index”;
对列操作,默认使用 axis=1 或者使用 “columns”。
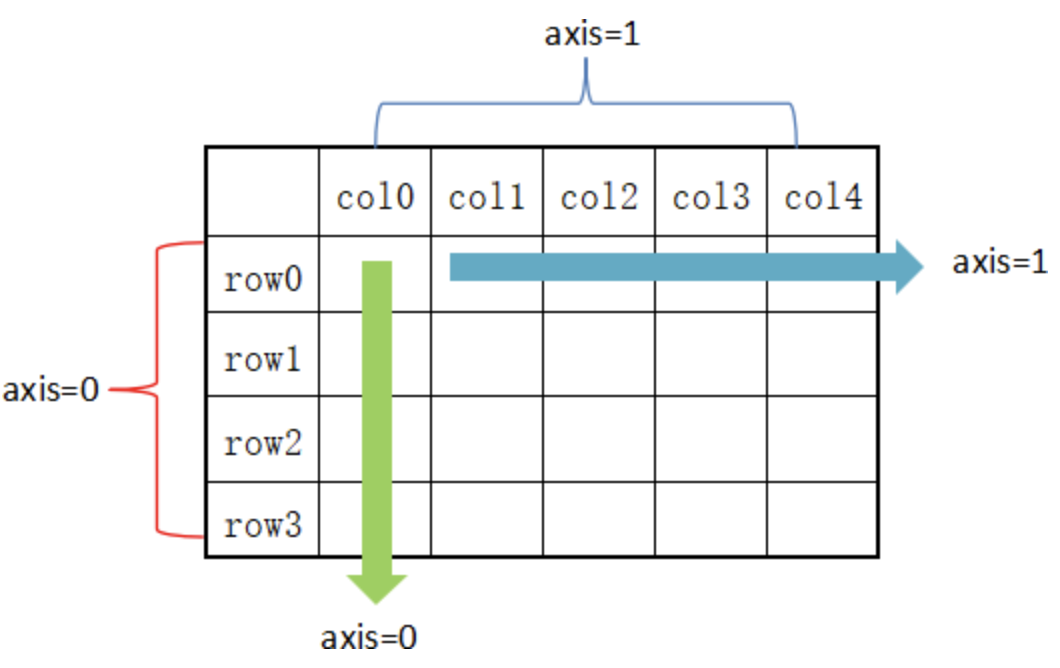 从图可以看出,axis=0 表示按垂直方向进行计算,而 axis=1 则表示按水平方向。
sum()求和
在默认情况下,返回 axis=0 的所有值的和。
#创建字典型series结构
d = {'Name':pd.Series(['小明','小亮','小红','小华','老赵','小曹','小陈',
   '老李','老王','小冯','小何','老张']),
   'Age':pd.Series([25,26,25,23,30,29,23,34,40,30,51,46]),
   'Rating':pd.Series([4.23,3.24,3.98,2.56,3.20,4.6,3.8,3.78,2.98,4.80,4.10,3.65])
}
df = pd.DataFrame(d)
df
| Name | Age | Rating | |
|---|---|---|---|
| 0 | 小明 | 25 | 4.23 |
| 1 | 小亮 | 26 | 3.24 |
| 2 | 小红 | 25 | 3.98 |
| 3 | 小华 | 23 | 2.56 |
| 4 | 老赵 | 30 | 3.20 |
| 5 | 小曹 | 29 | 4.60 |
| 6 | 小陈 | 23 | 3.80 |
| 7 | 老李 | 34 | 3.78 |
| 8 | 老王 | 40 | 2.98 |
| 9 | 小冯 | 30 | 4.80 |
| 10 | 小何 | 51 | 4.10 |
| 11 | 老张 | 46 | 3.65 |
#默认axis=0或者使用sum("index")
print(df.sum())
Name      小明小亮小红小华老赵小曹小陈老李老王小冯小何老张
Age                            382
Rating                       44.92
dtype: object
注意:sum() 和 cumsum() 函数可以同时处理数字和字符串数据。下面再看一下 axis=1 的情况,如下所示:
print(df.sum(axis=1))
0     29.23
1     29.24
2     28.98
3     25.56
4     33.20
5     33.60
6     26.80
7     37.78
8     42.98
9     34.80
10    55.10
11    49.65
dtype: float64
mean()求均值
print(df.mean())
Age       31.833333
Rating     3.743333
dtype: float64
std()求标准差
print(df.std())
Age       9.232682
Rating    0.661628
dtype: float64
describe数据汇总描述
describe() 函数显示与 DataFrame 数据列相关的统计信息摘要。
print(df.describe())
             Age     Rating
count  12.000000  12.000000
mean   31.833333   3.743333
std     9.232682   0.661628
min    23.000000   2.560000
25%    25.000000   3.230000
50%    29.500000   3.790000
75%    35.500000   4.132500
max    51.000000   4.800000
describe() 函数输出了平均值、std 和 IQR 值(四分位距)等一系列统计信息。
Pandas reindex重置索引
重置索引(reindex)可以更改原 DataFrame 的行标签或列标签,并使更改后的行、列标签与 DataFrame 中的数据逐一匹配。通过重置索引操作,您可以完成对现有数据的重新排序。如果重置的索引标签在原 DataFrame 中不存在,那么该标签对应的元素值将全部填充为 NaN。
重置行列标签
N=20
#下面我们不去考虑每个函数的具体意思,只去关注结果
df = pd.DataFrame({
   'A': pd.date_range(start='2016-01-01',periods=N,freq='D'),
   'x': np.linspace(0,stop=N-1,num=N),
   'y': np.random.rand(N),
   'C': np.random.choice(['Low','Medium','High'],N).tolist(),
   'D': np.random.normal(100, 10, size=(N)).tolist()
})

df
| A | x | y | C | D | |
|---|---|---|---|---|---|
| 0 | 2016-01-01 | 0.0 | 0.786869 | Low | 93.234759 |
| 1 | 2016-01-02 | 1.0 | 0.627477 | High | 95.796426 |
| 2 | 2016-01-03 | 2.0 | 0.339050 | Low | 109.331537 |
| 3 | 2016-01-04 | 3.0 | 0.574832 | Low | 104.063895 |
| 4 | 2016-01-05 | 4.0 | 0.424389 | Medium | 110.734752 |
| 5 | 2016-01-06 | 5.0 | 0.713037 | High | 112.271701 |
| 6 | 2016-01-07 | 6.0 | 0.958037 | Medium | 111.626911 |
| 7 | 2016-01-08 | 7.0 | 0.988429 | Medium | 85.860609 |
| 8 | 2016-01-09 | 8.0 | 0.723241 | Medium | 104.987049 |
| 9 | 2016-01-10 | 9.0 | 0.458040 | High | 102.100842 |
| 10 | 2016-01-11 | 10.0 | 0.396474 | High | 106.750159 |
| 11 | 2016-01-12 | 11.0 | 0.815082 | Low | 85.520715 |
| 12 | 2016-01-13 | 12.0 | 0.449427 | High | 99.417791 |
| 13 | 2016-01-14 | 13.0 | 0.400966 | Medium | 96.604479 |
| 14 | 2016-01-15 | 14.0 | 0.192624 | High | 99.445949 |
| 15 | 2016-01-16 | 15.0 | 0.916631 | High | 100.782781 |
| 16 | 2016-01-17 | 16.0 | 0.382247 | Medium | 111.466805 |
| 17 | 2016-01-18 | 17.0 | 0.197341 | High | 81.139682 |
| 18 | 2016-01-19 | 18.0 | 0.300417 | Medium | 111.079628 |
| 19 | 2016-01-20 | 19.0 | 0.761067 | Medium | 92.171132 |
#重置行、列索引标签
df_reindexed = df.reindex(index=[0,2,5], columns=['A', 'C', 'B'])
df_reindexed
| A | C | B | |
|---|---|---|---|
| 0 | 2016-01-01 | Low | NaN |
| 2 | 2016-01-03 | Low | NaN |
| 5 | 2016-01-06 | High | NaN |
reindex_like()
现有 a、b 两个 DataFrame 对象,如果想让 a 的行索引与 b 相同,您可以使用 reindex_like() 方法。示例如下:
a = pd.DataFrame(np.random.randn(10,3),columns=['col1','col2','col3'])
b = pd.DataFrame(np.random.randn(7,3),columns=['col1','col2','col3'])
a= a.reindex_like(b)
print(a)
       col1      col2      col3
0 -1.628672 -0.583674 -0.441093
1  0.165955 -0.480662 -1.768928
2  0.052035  0.499503  0.164273
3  0.178304 -0.015302  0.175067
4  1.011947  0.211428  1.564608
5 -1.002858 -0.670168 -0.590156
6  1.127713 -0.414167 -0.183754
上述示例,a 会按照 b 的形式重建行索引。需要特别注意的是,a 与 b 的列索引标签必须相同。
填充元素值
reindex_like() 提供了一个可选的参数method,使用它来填充相应的元素值,参数值介绍如下:
pad/ffill:向前填充值;
bfill/backfill:向后填充值;
nearest:从距离最近的索引值开始填充。
df1 = pd.DataFrame(np.random.randn(6,3),columns=['col1','col2','col3'])
df2 = pd.DataFrame(np.random.randn(2,3),columns=['col1','col2','col3'])
#使df2和df1行标签相同
print("#填充前")
print(df2.reindex_like(df1))
#向前填充
print("#填充后")
print(df2.reindex_like(df1,method='ffill'))
#填充前
       col1      col2      col3
0 -0.374528  0.852631 -1.399773
1  0.002027  0.490353  2.190524
2       NaN       NaN       NaN
3       NaN       NaN       NaN
4       NaN       NaN       NaN
5       NaN       NaN       NaN

#填充后
       col1      col2      col3
0 -0.374528  0.852631 -1.399773
1  0.002027  0.490353  2.190524
2  0.002027  0.490353  2.190524
3  0.002027  0.490353  2.190524
4  0.002027  0.490353  2.190524
5  0.002027  0.490353  2.190524
限制填充行数
reindex_like() 还提供了一个额外参数 limit,该参数用来控制填充的最大行数。示例如下:
df1 = pd.DataFrame(np.random.randn(6,3),columns=['col1','col2','col3'])
df2 = pd.DataFrame(np.random.randn(2,3),columns=['col1','col2','col3'])
print("#填充前")
print (df2.reindex_like(df1))
#最多填充2行
print("#填充后")
print (df2.reindex_like(df1,method='ffill',limit=2))
#填充前
       col1      col2      col3
0 -1.065744 -0.628913 -0.890608
1 -0.868149  0.323155  0.592059
2       NaN       NaN       NaN
3       NaN       NaN       NaN
4       NaN       NaN       NaN
5       NaN       NaN       NaN
#填充后
       col1      col2      col3
0 -1.065744 -0.628913 -0.890608
1 -0.868149  0.323155  0.592059
2 -0.868149  0.323155  0.592059
3 -0.868149  0.323155  0.592059
4       NaN       NaN       NaN
5       NaN       NaN       NaN
rename()
rename() 方法允许您使用某些映射(dict或Series)或任意函数来对行、列标签重新命名,示例如下:
df1 = pd.DataFrame(np.random.randn(6,3),columns=['col1','col2','col3'])
print("命名前")
print (df1)
#对行和列重新命名
print("命名后")
print (df1.rename(columns={'col1' : 'c1', 'col2' : 'c2'},index = {0 : 'apple', 1 : 'banana', 2 : 'durian'}))
命名前
       col1      col2      col3
0 -1.742492  0.345284  0.689351
1 -0.296505  0.359762  0.193635
2  1.780848 -1.577495 -0.523360
3  0.511229 -0.147474  0.284064
4 -0.627686 -1.270925  1.444171
5  0.420444 -1.219966 -1.664974

命名后
              c1        c2      col3
apple  -1.742492  0.345284  0.689351
banana -0.296505  0.359762  0.193635
durian  1.780848 -1.577495 -0.523360
3       0.511229 -0.147474  0.284064
4      -0.627686 -1.270925  1.444171
5       0.420444 -1.219966 -1.664974
Pandas iteration遍历
在 Pandas 中同样也是使用 for 循环进行遍历。通过for遍历后,Series 可直接获取相应的 value,而 DataFrame 则会获取列标签。示例如下
N=20
df = pd.DataFrame({
   'A': pd.date_range(start='2016-01-01',periods=N,freq='D'),
   'x': np.linspace(0,stop=N-1,num=N),
   'y': np.random.rand(N),
   'C': np.random.choice(['Low','Medium','High'],N).tolist(),
   'D': np.random.normal(100, 10, size=(N)).tolist()
   })
print(df)
            A     x         y       C           D
0  2016-01-01   0.0  0.309422    High  105.842396
1  2016-01-02   1.0  0.287303  Medium  102.596000
2  2016-01-03   2.0  0.351692     Low  102.683707
3  2016-01-04   3.0  0.715536     Low   96.667884
4  2016-01-05   4.0  0.323528     Low  102.065947
5  2016-01-06   5.0  0.611588  Medium   97.882380
6  2016-01-07   6.0  0.242535     Low   99.169613
7  2016-01-08   7.0  0.577218  Medium  105.902458
8  2016-01-09   8.0  0.269061     Low   92.299404
9  2016-01-10   9.0  0.708889    High   92.956118
10 2016-01-11  10.0  0.058634  Medium   86.844656
11 2016-01-12  11.0  0.605411    High   87.704475
12 2016-01-13  12.0  0.078466    High  101.054271
13 2016-01-14  13.0  0.658722    High   85.400332
14 2016-01-15  14.0  0.381965     Low   97.605393
15 2016-01-16  15.0  0.505028  Medium  113.053962
16 2016-01-17  16.0  0.815197    High  106.798395
17 2016-01-18  17.0  0.995368     Low   90.806364
18 2016-01-19  18.0  0.120795  Medium  103.408369
19 2016-01-20  19.0  0.327199    High  135.356433
for col in df:
    print (col)
A
x
y
C
D
内置迭代方法
如果想要遍历 DataFrame 的每一行,我们下列函数:
1) iteritems():以键值对 (key,value) 的形式遍历;
2) iterrows():以 (row_index,row) 的形式遍历行;
3) itertuples():使用已命名元组的方式对行遍历。
iteritems()
以键值对的形式遍历 DataFrame 对象,以列标签为键,以对应列的元素为值。
df = pd.DataFrame(np.random.randn(4,3),columns=['col1','col2','col3'])
df
| col1 | col2 | col3 | |
|---|---|---|---|
| 0 | 0.179303 | 0.536200 | 0.259813 |
| 1 | -0.730208 | -1.200034 | -1.100648 |
| 2 | -0.946189 | -1.478875 | -0.587366 |
| 3 | 1.020445 | 0.255881 | -0.799191 |
for key,value in df.iteritems():
    print (key,value)
col1 0    0.179303
1   -0.730208
2   -0.946189
3    1.020445
Name: col1, dtype: float64
col2 0    0.536200
1   -1.200034
2   -1.478875
3    0.255881
Name: col2, dtype: float64
col3 0    0.259813
1   -1.100648
2   -0.587366
3   -0.799191
Name: col3, dtype: float64
iterrows()
该方法按行遍历,返回一个迭代器,以行索引标签为键,以每一行数据为值。示例如下:
for row_index,row in df.iterrows():
    print (row_index,row)
0 col1    0.179303
col2    0.536200
col3    0.259813
Name: 0, dtype: float64
1 col1   -0.730208
col2   -1.200034
col3   -1.100648
Name: 1, dtype: float64
2 col1   -0.946189
col2   -1.478875
col3   -0.587366
Name: 2, dtype: float64
3 col1    1.020445
col2    0.255881
col3   -0.799191
Name: 3, dtype: float64
itertuples()
itertuples() 同样将返回一个迭代器,该方法会把 DataFrame 的每一行生成一个元组,示例如下:
for row in df.itertuples():
    print(row)
Pandas(Index=0, col1=0.17930285451251501, col2=0.5361995229504988, col3=0.25981254861413866)
Pandas(Index=1, col1=-0.7302079707854569, col2=-1.200033803486064, col3=-1.1006482553793395)
Pandas(Index=2, col1=-0.9461890560037862, col2=-1.478874967811546, col3=-0.5873663693797115)
Pandas(Index=3, col1=1.0204445533871827, col2=0.25588127211650025, col3=-0.7991909264093302)
迭代返回副本
迭代器返回的是原对象的副本,所以,如果在迭代过程中修改元素值,不会影响原对象
df = pd.DataFrame(np.random.randn(3,3),columns = ['col1','col2','col3'])
for index, row in df.iterrows():
    #假设说我们要将其增加一列
    row['a'] = 15
print (df)
#发现原来的df没有改变
       col1      col2      col3
0 -1.065696  1.325678 -1.170486
1 -0.714478  0.549454  0.671538
2 -0.082885 -1.518229  0.302107
Pandas sorting排序
按标签排序
使用 sort_index() 方法对行标签排序,指定轴参数(axis)或者排序顺序。或者可以对 DataFrame 进行排序。默认情况下,按照行标签序排序。
#行标签乱序排列,列标签乱序排列
unsorted_df=pd.DataFrame(np.random.randn(10,2),index=[1,6,4,2,3,5,9,8,0,7],columns=['col2','col1'])
print(unsorted_df)
       col2      col1
1  1.526377  1.445458
6  1.065364 -0.333095
4 -0.213595  0.840036
2 -0.314056  0.348687
3  0.492836 -1.345225
5 -0.347495  0.019047
9  1.611026  0.196454
8 -1.057069  0.733011
0 -0.327377  0.661649
7  0.403446  0.918134
sorted_df=unsorted_df.sort_index()
print(sorted_df)
       col2      col1
0 -0.327377  0.661649
1  1.526377  1.445458
2 -0.314056  0.348687
3  0.492836 -1.345225
4 -0.213595  0.840036
5 -0.347495  0.019047
6  1.065364 -0.333095
7  0.403446  0.918134
8 -1.057069  0.733011
9  1.611026  0.196454
按列标签排序
通过给 axis 轴参数传递 0 或 1,可以对列标签进行排序。默认情况下,axis=0 表示按行排序;而 axis=1 则表示按列排序。
sorted_df=unsorted_df.sort_index(axis=1)
print (sorted_df)
       col1      col2
1  1.445458  1.526377
6 -0.333095  1.065364
4  0.840036 -0.213595
2  0.348687 -0.314056
3 -1.345225  0.492836
5  0.019047 -0.347495
9  0.196454  1.611026
8  0.733011 -1.057069
0  0.661649 -0.327377
7  0.918134  0.403446
按值排序
与标签排序类似,sort_values() 表示按值排序。它接受一个by参数,该参数值是要排序数列的 DataFrame 列名。示例如下:
unsorted_df = pd.DataFrame({'col1':[2,1,1,1],'col2':[1,3,2,4]})
sorted_df = unsorted_df.sort_values(by='col1')
print (sorted_df)
   col1  col2
1     1     3
2     1     2
3     1     4
0     2     1
Pandas去重函数:drop_duplicates()
data={

    'A':[1,0,1,1],
    'B':[0,2,5,0],
    'C':[4,0,4,4],
    'D':[1,0,1,1]
}
df=pd.DataFrame(data=data)
print(df)
   A  B  C  D
0  1  0  4  1
1  0  2  0  0
2  1  5  4  1
3  1  0  4  1
df.drop_duplicates()
| A | B | C | D | |
|---|---|---|---|---|
| 0 | 1 | 0 | 4 | 1 |
| 1 | 0 | 2 | 0 | 0 |
| 2 | 1 | 5 | 4 | 1 |
发现最后一行被去掉了
Pandas处理字符串
常用的字符串处理函数如下表所示:
| 函数名称 | 函数功能和描述 |
|---|---|
| lower() | 将字符串转换为小写 |
| upper() | 将字符串转换为大写 |
| len() | 得出字符串的长度 |
| strip() | 去除字符串两边的空格(包含换行符 |
| split() | 用指定的分割符分割字符串 |
| cat(sep=””) | 用给定的分隔符连接字符串元素 |
| get_dummies() | 返回一个带有独热编码值的Data Frame结构 |
| contains(pattern) | 如果子字符串包含在元素中, 则为每个元素返回一个布尔值True, 否则为False |
| replace(a,b) | 将值a替换为值b |
| count(pattern) | 返回每个字符串元素出现的次数 |
| startswith(pattern) | 如果Series中的元素以指定的字符串开头, 则返回True |
| endswith(pattern) | 如果Series中的元素以指定的字符串结尾, 则返回True |
| findall(pattern) | 以列表的形式返出现的字符串 |
| swapcase() | 交换大小写 |
| islower() | 返回布尔值, 检查Series中组成每个字符串的所有字符是否都为小写 |
| issupper() | 返回布尔值, 检查Series中组成每个字符串的所有字符是否都为大写 |
| isnumeric() | 返回布尔值, 检查Series中组成每个字符串的所有字符是否都为数字 |
| repeat(value) | 以指定的次数重复每个元素 |
| find(pattern) | 返回字符串第一次出现的索引位置 |
这里我们讲解几个较为常用的函数:
len()
len()得出字符串的长度。
s = pd.Series(['C', 'Python', 'java', 'go', np.nan, '1125','javascript'])
print(s.str.len())
0     1.0
1     6.0
2     4.0
3     2.0
4     NaN
5     4.0
6    10.0
dtype: float64
split()
用指定的分割符分割字符串。
s = pd.Series(['C ',' Python','java','go','1125 ','javascript'])
print(s.str.split(" "))
0           [C, ]
1      [, Python]
2          [java]
3            [go]
4        [1125, ]
5    [javascript]
dtype: object
cat(sep=””)
用给定的分隔符连接字符串元素。
s = pd.Series(['C', 'Python', 'java', 'go', np.nan, '1125','javascript'])
#会自动忽略NaN
print(s.str.cat(sep="_"))
C_Python_java_go_1125_javascript
get_dummies()
返回一个带有独热编码值的 DataFrame 结构。
s = pd.Series(['C', 'Python', 'java', 'go', np.nan, '1125','javascript'])
print(s.str.get_dummies())
   1125  C  Python  go  java  javascript
0     0  1       0   0     0           0
1     0  0       1   0     0           0
2     0  0       0   0     1           0
3     0  0       0   1     0           0
4     0  0       0   0     0           0
5     1  0       0   0     0           0
6     0  0       0   0     0           1
Comments
Be the first one to comment on this page!